Grafana Fundamentals: hands-on documentation review
Tested: 22 October 2026
Tutorial: Grafana Fundamentals
Sample environment: grafana/tutorial-environment
Scope: Independent portfolio review, not affiliated with or endorsed by Grafana Labs. Findings reflect the tutorial and Grafana 12.0.1 as tested on 22 October 2026; UI details may vary by version.
Summary
I followed the setup, metrics, logs, dashboard, and annotation exercises using Grafana's sample environment. The containers started successfully, and I queried metrics, explored logs, generated an application error, built a dashboard panel, and displayed the error as an annotation.
The main issues were outdated dashboard instructions, a misleading Prometheus data-source reference, and missing recovery guidance when a log time-range selection returned no data. I also found a Docker Compose warning and several smaller navigation and consistency improvements. The later alerting section was not tested.
Test environment
| Component | Version or details |
|---|---|
| Host OS | Ubuntu 26.04.1 LTS |
| Docker | 29.1.3, build 29.1.3-0ubuntu4.1 |
| Docker Compose | 2.40.3+ds1-0ubuntu1, invoked as docker compose |
| Grafana | 12.0.1 in the sample environment |
The services started successfully with docker compose up -d. Compose displayed two warnings: the top-level version field is obsolete, and Buildx was not installed. Neither warning stopped the build or startup in this test.
Findings
1. Correct the Prometheus data-source instruction
Where: Build a dashboard, step 4.
The tutorial says to select the Prometheus data source “that you just added.” However, Prometheus is already configured during setup; the later data-source step adds Loki. In my Grafana 12.0.1 interface, Prometheus was marked Default.
Suggested wording:
Select the Prometheus data source. It should be marked Default.
This is the clearest content inconsistency and should be fixed first.
2. Update dashboard and annotation steps for Grafana 12
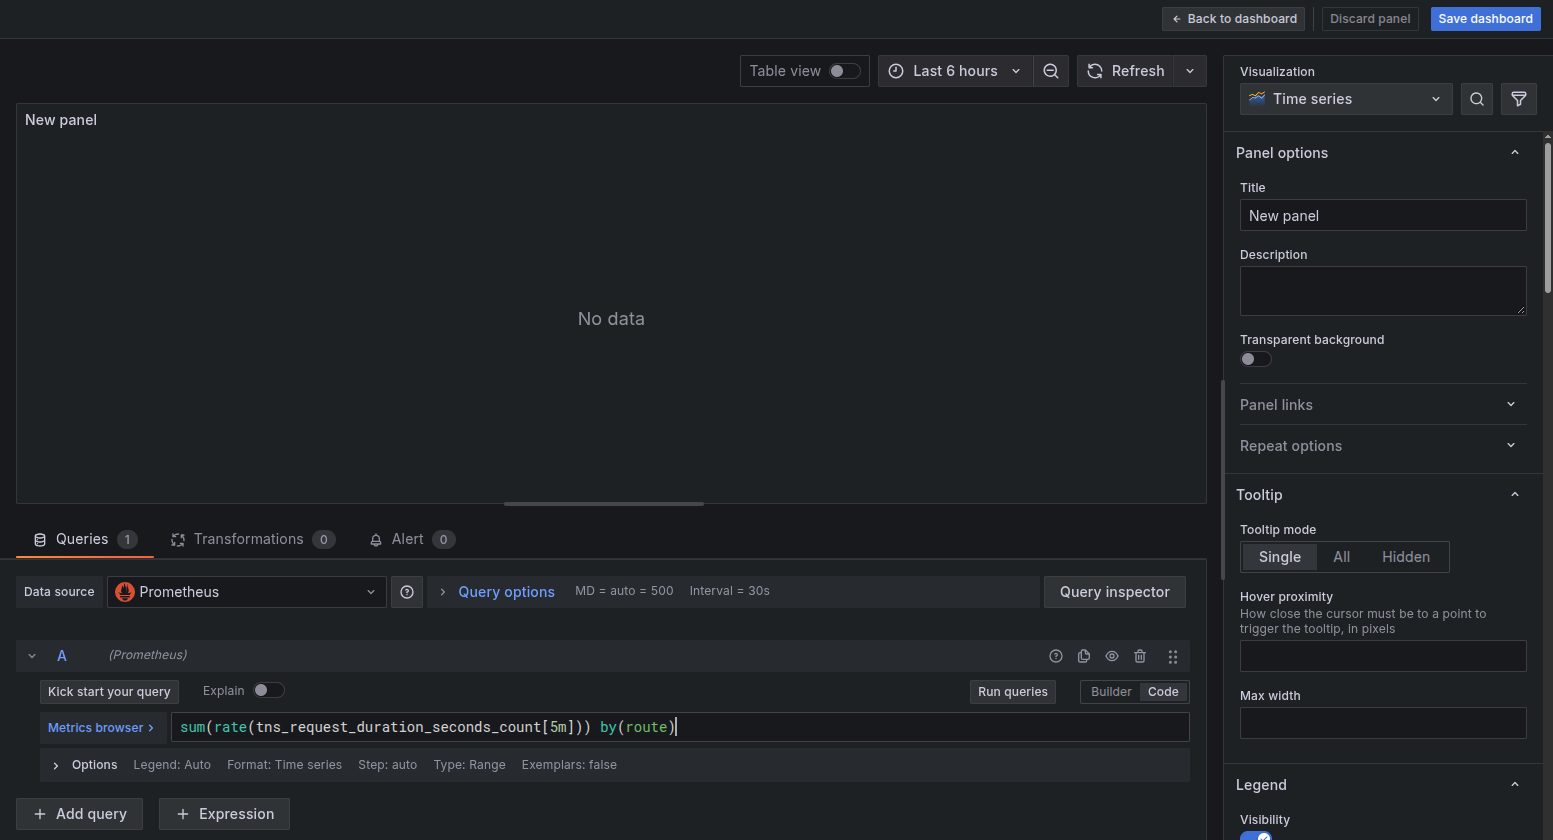
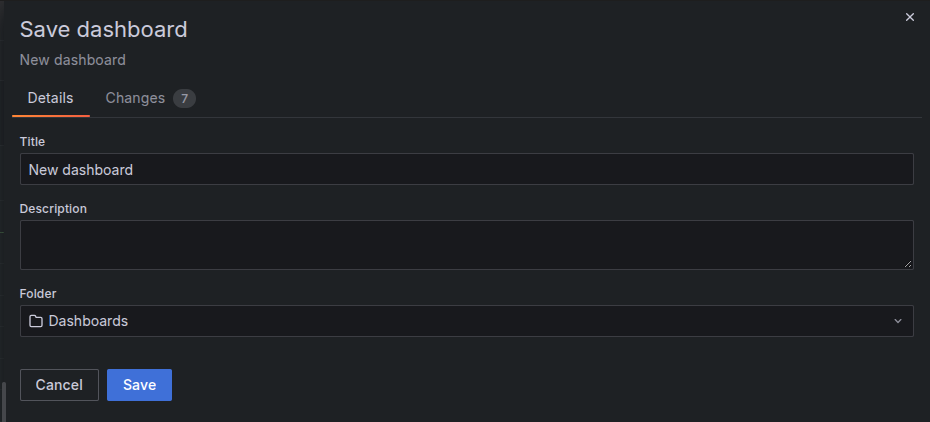
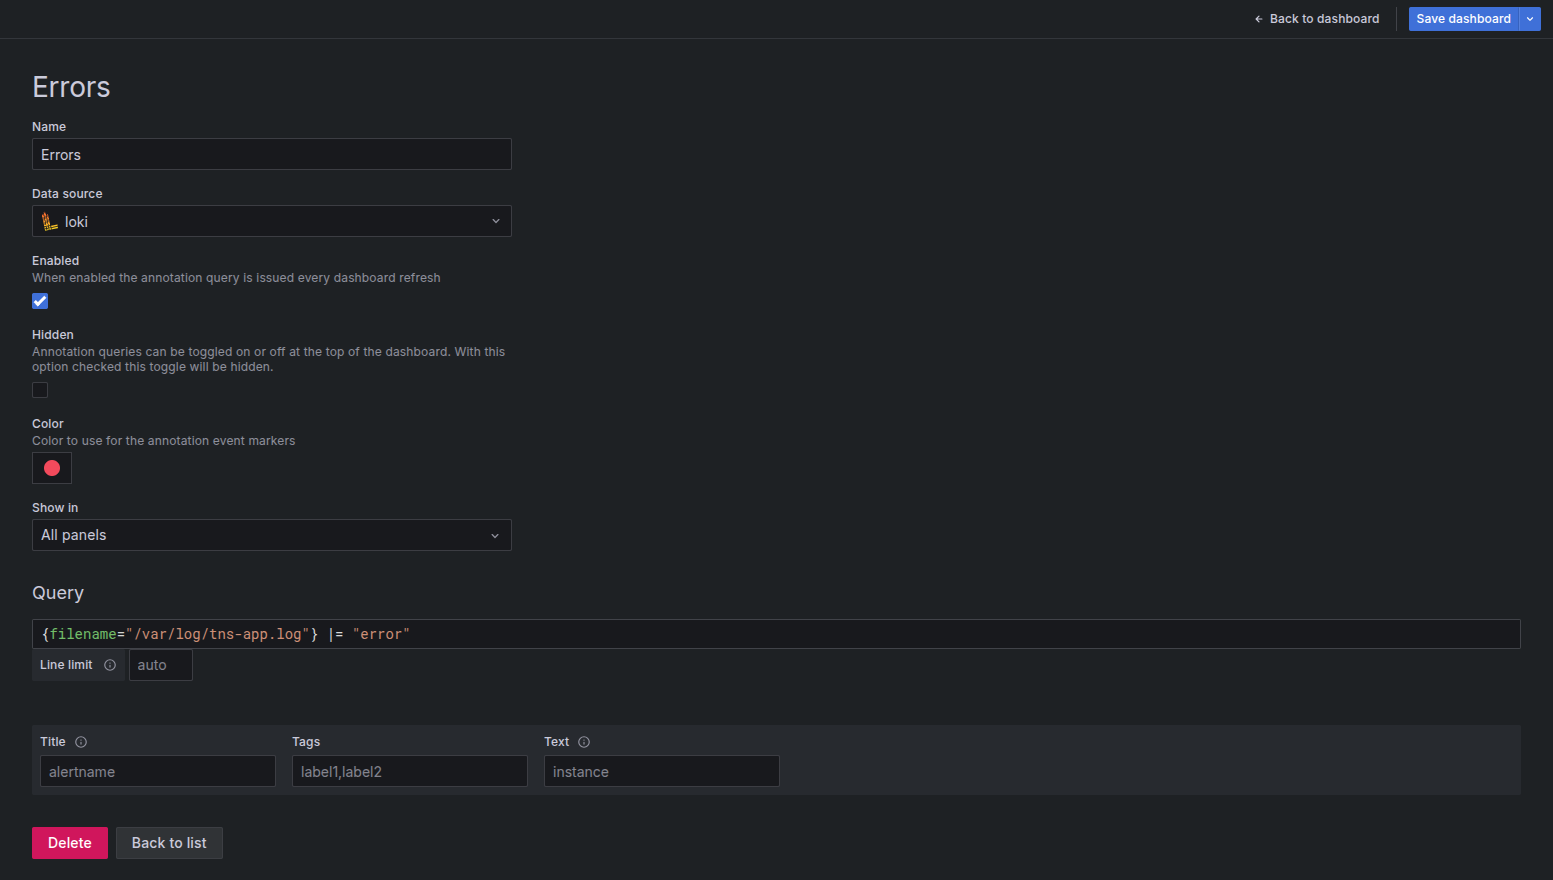
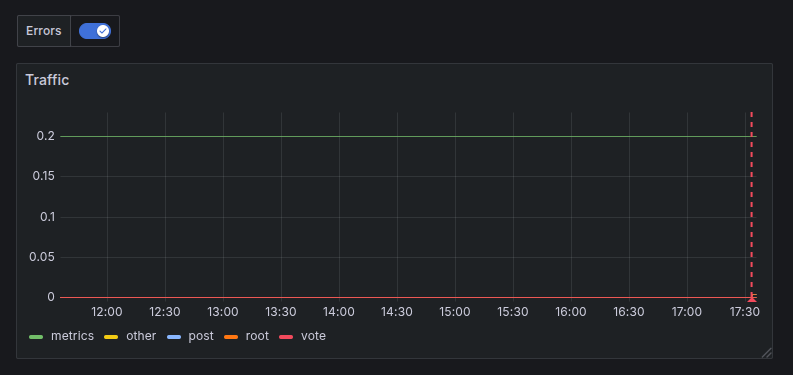
The tutorial refers to an Apply button, a disk icon for saving, and a gear icon for dashboard settings. I could not find these controls in the Grafana 12.0.1 interface I tested. The panel title was edited under Panel options; saving the dashboard opened a side panel with fields including Title, Description, and Folder. The dashboard toolbar exposed a text button labelled Settings. In the annotation workflow, I also found no Apply button, and the annotation appeared on the graph only after I refreshed the dashboard.
Recommendation: Recheck these steps against the Grafana version the tutorial supports. Use visible control labels rather than icon descriptions, explain the fields readers need to complete, and tell readers to refresh the dashboard if the generated error annotation does not appear. Avoid presenting Grafana 12 labels as universal across versions.

3. Explain how to recover from an empty log time range
Where: Explore your logs, after the instruction to drag across the histogram.
Dragging across the histogram changed the selected time range. In my test, it narrowed the range to a single second, and Grafana displayed “No logs volume available” and “No logs found.” The tutorial does not explain that the selection changes the time range or how to recover. I restored the logs by selecting /var/log/tns-app.log under filename in the Label browser and clicking Show logs.
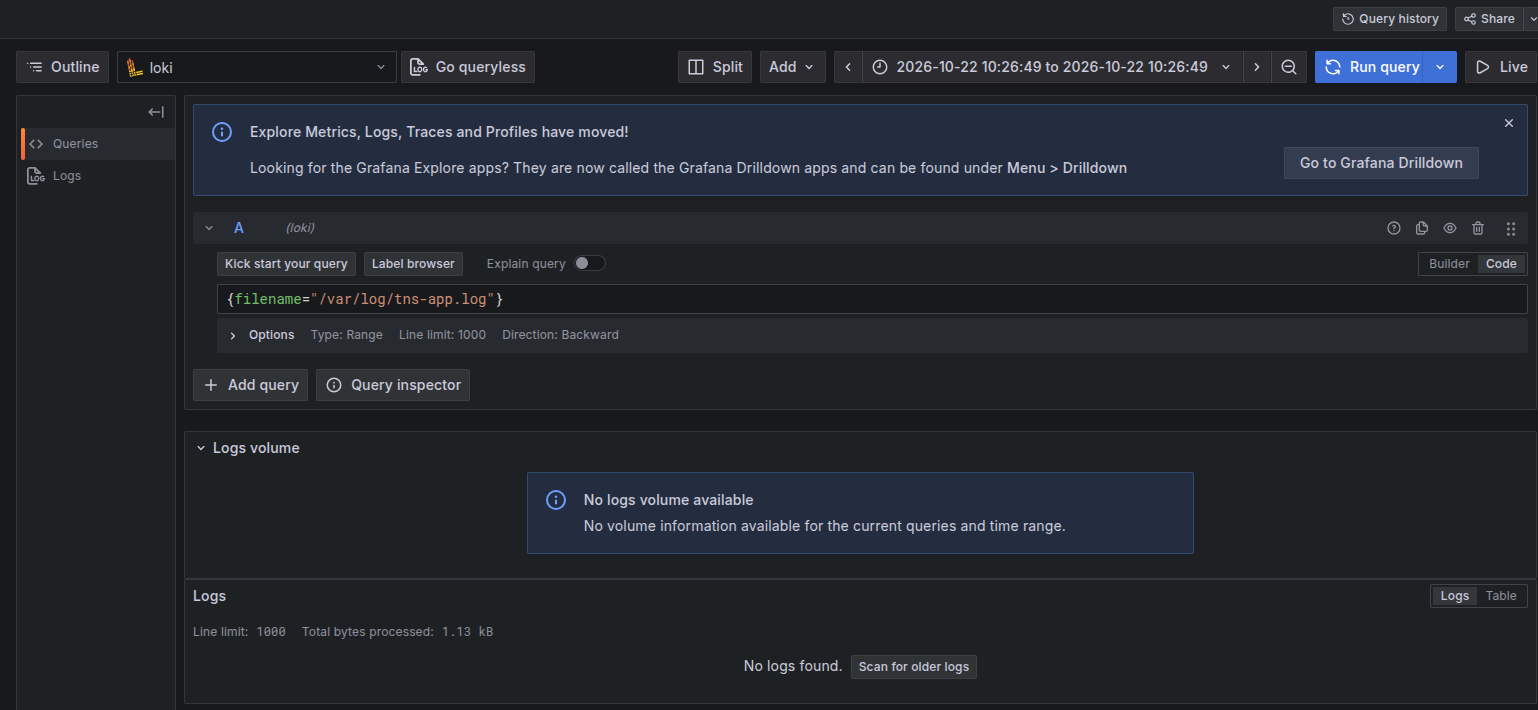
Suggested addition:
Dragging across the histogram changes the selected time range. If no logs appear, select a wider range in the time picker and run the query again. You can also select
/var/log/tns-app.logunder filename in the Label browser and click Show logs.
4. Align Docker Compose instructions with the tested setup
The tutorial uses docker-compose commands; my environment used Docker Compose v2 through docker compose. I confirmed the space-separated commands worked, but did not test whether the hyphenated command was installed. The sample docker-compose.yml also declares the top-level version: "3", which produces an obsolete-field warning with modern Compose. Docker documents that this field is obsolete and ignored.
Recommendation: Use docker compose consistently for the documented setup, or explain the difference if both forms are intentionally supported. Remove the obsolete version field from the sample environment, or add a brief note that the warning can be ignored if the build and services start successfully.
5. Clarify Explore, query execution, and the data-source selector
Grafana 12 displayed a notice that the Metrics, Logs, Traces, and Profiles exploration apps had moved to Drilldown. Grafana's documentation distinguishes these queryless Drilldown apps from Explore, where users write and analyze PromQL and LogQL queries. A short note would help readers avoid navigating away from the query editor.
The tutorial could also be more consistent about running queries. At the first query, explain that readers can select Run query or press Shift+Enter where supported. Provide complete, copyable queries for the alternative grouping example, and say “enter and run the following query” when introducing the log filter. For navigation, use “If the sidebar is collapsed, select the menu icon to open it” rather than repeatedly instructing readers to click an already-visible menu.
6. Make the error-generation step more explicit
Where: Explore your logs.
The tutorial asks readers to post a link without a URL. I found it clearer to give the sample entry a specific title.
Suggested wording:
In the sample application, enter
Error examplein Title, leave URL empty, and select Submit. This generates an error containingempty url.
I reproduced the expected application error with this step.
Follow-up checks
- Login behavior: The tutorial says the Docker demo does not require login, but I encountered a password-change prompt after entering
admin/admin. The sample Compose file enables anonymous access and disables basic authentication. I have not established which instance or configuration produced the prompt, so I would verify it with a clean environment before reporting it as a defect. - Buildx warning: Compose warned that Buildx was not installed while building with Bake, but the image built and the services started. I did not establish that this warning affects other users; it should not be presented as a required fix without further investigation.
Recommended order of changes
- Correct the Prometheus data-source reference.
- Update the dashboard and annotation instructions to match the supported Grafana UI.
- Add log time-range recovery guidance.
- Align Docker Compose commands and remove or explain the obsolete
versionfield. - Clarify Explore/Drilldown, query execution, and error-generation steps.
- Reproduce the login discrepancy before reporting it.
How I reviewed the tutorial
I ran the tutorial on the environment above, recorded observations, and checked the findings against the published tutorial, the sample repository, and the documentation below. I used an AI assistant to help organize and edit the report, then reviewed it against my notes.
Sources
- Grafana Fundamentals tutorial
- Grafana tutorial environment repository
- Docker Compose: version and name top-level elements
- Docker Compose FAQ
- What are the Grafana Drilldown apps?
- Grafana sign-in documentation
- Save a dashboard
Limitations
The review combines hands-on observations with checks against public documentation. UI findings apply to Grafana 12.0.1 and may vary by version. I did not test the alerting section or establish the cause of the login prompt and Buildx warning.